City has an intrinsic relationship with its periphery or surrounding area. An urban geographer must determine the spatial extent up to which the city influences social, economic and cultural landscape to make effective policies for development. Therefore, we should know the methods of demarcation of Umland. However, let us first understand the meaning of Umland.
What is Umland?
- Umland is an area of influence of a city which provides goods and services to the city dwellers for proper functioning of city and gets back high value goods and services from the city.
- In a sense, Umland is the spatial extent up to which people and processes are connected with the city. In this regard, we have to consider only those people and processes which interact with the city, frequently. Therefore, spontaneous visit by foreigners or export and import with foreign countries is not a part of this interaction.
- Umland represents the area or sphere of influence of a city. Area of influence means the predominance of a city over its surroundings relative to to other cities. For instance, Delhi has a substantial social and economic influence on the areas in National Capital Region. This influence extends up to Karnal in the North, Manesar in the South, Rohtak in the West and Ghaziabad in the East.
- Distance Decay: The influence of a city declines with increasing distance and stops at a certain point.
- Usually, the area of influence or limit of umland is co-terminus with the extent of transport services from the city and to the city. We have to include only local passenger transport services not the long route ones.
- Please note that the terms Umland, Hinterland and Sphere of Influence are synonyms of each other.
Read Cumulative Causation Theory, Unbalanced Growth Theory and Growth Pole Theory for understanding the relationship of city with its Umland/Hinterland/Periphery.
Methods of Demarcation of Umland
Demarcation of Umland helps in planning, administration and policy formation for the City Regions. So, formation of targeted policies for regional development needs demarcation of umland of the city. First step to delimit umland is to collect the socio-economic data. Then we have to plot that data on map to arrive at limit of umland. There are following methods of collection of data for demarcation or delimitation of umland.
Field Enquiry in the City
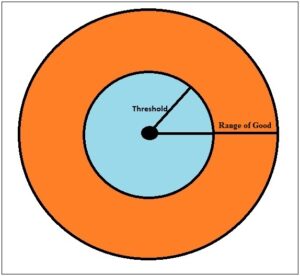
The researcher can conduct a field inquiry or survey within the city. The surveyor can interview two types of people i.e. service provider and service users. The surveyor or interviewer can ask the service providers such as shopkeepers, wholesalers, doctors etc. about the address of their customers. The address of customers will tell us the distance from which a customer travels to city for availing services. The interviewer can directly ask the customers about the purpose of their visit to city and their address. This way, the researcher can determine the range of different goods and services from the city. The range of goods and threshold (Fig. 1) of city has been explained in the Christaller’s Central Place Theory.
Field Survey in City Surroundings
The researcher can also visit the settlements surrounding the city. These settlements can be small towns or villages. The questions may be of various types. For example, how often do you visit the city or why do you visit the city etc. The researcher can start from the municipal boundary of the city and move outwards. There are many things to notice in the periphery e.g. the dress, language, direct roads, proximity to other towns etc. These observations will point towards the impact of city on the people along with exchange of goods, services and ideas between city and periphery. When the impact of city on the psyche of people is not noticeable, one can conclude that we have reached the boundary of umland. This method of demarcation needs extensive field survey in all directions form the city. Hence it is very expensive and time consuming process.
Secondary Data
The secondary data is that information which has already been collected by other individuals or institutions. This data includes data from government organizations, schools, colleges, topographical sheets, newspaper distribution networks etc. A researcher can draw a series of isopleths based on this data to arrive at limit of the umland. For instance, the address of students in a school can tell us the distance from which the students are ready to travel to city for education. Similarly, the limit of newspaper distribution network and transport network convey us the maximum distance from which customers can, frequently, come to city for goods and services.
Plotting of Data
Once the data has been collected, the researcher has to plot it on map for delimiting the boundary of city’s influence. We can plot the data as per Christaller or like Losch.
Christaller’s Method
Christaller drew the boundary of city’s influence in hexagonal pattern. He gave three principles to arrive at umland’s boundary as following.
- Marketing Principle (K=3)
- Transport Principle (K=4)
- Administrative Principle (K=7)
To plot like Christaller, we have to consider the maximum distance from which people are ready to travel to city for marketing, transport and administration. For details, see Christaller’s Central Place Theory.
Losch’s Method
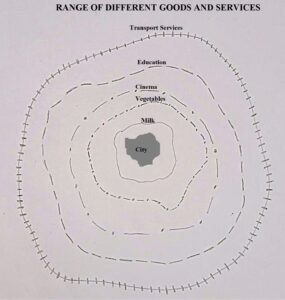
Unlike Christaller, the Losch’s theory suggests that different goods and services have different range (See Fig. 2). For example, a resident of a village can buy copy, pen, sugar etc. from local shops and will not go to city to buy that. However, the city provides high end services such as medical surgery, sale of vehicles, branded clothing etc. Therefore, the customers from villages from farther places will come to city.
We can also feed this data in ArcMap or ArcGIS software to come at a reasonable boundary of umland. Since, the range of different goods is different, we may consider following options.
- The good with maximum range can be used to draw umland’s boundary.
- The boundary where the range of maximum number of goods overlap, may be considered umland’s limit. For example, if customers from villages which are located around 10 Kms. away from the city, come to avail many services such as education, health, clothing, entertainment etc. Then umland’s boundary will be about 10 Kms. away from the city in all directions.
- We can also draw the boundary based on that good for which customers come frequently to the city from the periphery. For example, if customers come to city for higher education, frequently, we will observe the distance from which they travel. Then, we can plot the data on a map around the city.
Other Methods
Apart from the above methods, the researchers can use any logical way to draw umland. For instance, one can collect employment data of villages in city’s periphery. Then plot the data pertaining to proportion of agricultural workers on a map. We can assume that the city’s influence stops where the proportion of agricultural workers is greater than 50%. Then join the locations around the city where the proportion of agricultural workers starts to become greater than 50 percent. This way, we will arrive at boundary of city’s influence. Similarly, we can use primary or secondary transport data, industrial data, educational data etc.
Conclusion
In sum, boundary of umland is not constant or fixed. It changes with time as the socio-economic influence of city spreads. The researcher may use different methodologies of demarcation of umland based on the objectives of the research. Nevertheless, the boundary of umland is co-terminus with local transport network, range of goods and services. The boundary will not be equidistant from city center due to unevenness of topography and accessible modes of transport.
Kulwinder Singh is an alumni of Jawaharlal Nehru University, New Delhi and working as Assistant Professor of Geography at Pt. C.L.S. Government College, Kurukshetra University. He is a passionate teacher and avid learner.