The functional classification of towns by Nelson is based on experience of North American cities. He provided this classification of towns in his research paper “A Service Classification of American Cities” in 1955. He improved upon the Classification of Cities by C. D. Harris. However, Nelson’s method is more objective and has lesser individual bias than Harris’s classification.
Characteristics of Nelson’s Classification
Howard Nelson chose Work Participation Rate (WPR) in various industries as an indicator for assessing that city’s dominance in various functions to varying degrees. According to Nelson, there are nine major industry groups in the USA. These industries are 1. Manufacturing (M), 2. Retail Trade (R), 3. Professional Services (Pf), 4. Transportation & Communication (T), 5. Personal Services (Ps), 6. Public Administration (Pb), 7. Wholesale Trade (W), 8. Finance, Insurance & Real Estate (F) and 9. Mining (Mi).
Criteria for Specialization of an Industrial Function
- Basically, a function will only be attributed to a city when the share of workers in a particular industry is greater than or equal to the national average share of workers. In other words, he omitted smaller industry and service sectors such as agriculture and construction because the share of the American workforce in these sectors is miniscule. For instance, assume that 30 percent of total workers in Kentucky work in the IT industry but the national average is 35 percent, then we will not classify Kentucky as a Service Town, even if IT workers form the largest proportion of Kentucky’s workforce.
- Please note that a town may be specialized in more than one industry according to this classification.
- As an illustration, if Mumbai’s proportion of workers in manufacturing is 45 percent and national average is 41 percent, it will be categorized as a manufacturing town. However, if the proportion of workers in Public Administration is 35 percent in Mumbai against the 32 percent of national average, then the second most dominant industry will be Public Administration.
- In the above example, the most dominant industry is manufacturing.
- The cities which do not have a higher share of workers than the national average in any sector are classified as Diversified.
- Eventually, you may ask, “What is the degree of specialization of Mumbai in the manufacturing sector?”.
Nelson’s Methodology of Classification of Towns
With the help of the Standard Deviation (SD) method, Nelson was able to show the degree of dominance of other industries in comparison to the most dominant industry. To clarify, the degree of specialization is measured in multiples of standard deviation. We will learn to calculate the degree of specialization using following steps.
Further, we have to construct a matrix or table showing the national average, standard deviation (SD) and multiples of standard deviation.
Step I
Firstly, collect the industry wise data of workers for all the cities of the country. Secondly, calculate the proportion of workers in each industry by using a simple percentage formula as follows.
![]()
The above formula shows the calculation for arriving at the proportion of workers in the Manufacturing (Mf) sector. Thirdly, we will calculate the proportion of workers in all nine sectors. Finally, we will get the percentage of workers in each industry. Please note that this will be the national average or mean for each of the industries.
Step II
In this step, we have to calculate the percentage of workers in each industry for different cities of the country. The formula for calculating this is as follows.
![]()
The above formula shows the proportion of workers in the Manufacturing (Mf) sector for Mumbai. Similarly, calculate the proportion of workers in the manufacturing sector for all the cities.
Now, we have to repeat the same process for all the industries. Consequently, we will get the proportion of workers in each of the nine industries for all the cities. You will get data as shown below.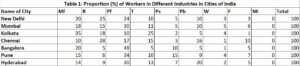
Earlier in Step I, we have already calculated national average or mean workers in each industry.
Step III
In this step, we will calculate the standard deviation of each industry across the cities by using the following formulae.
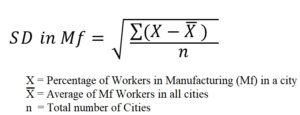
- In the above formulae X-Mean will be calculated for each city. Then all the values will be summed and divided by the total number of cities (n). By using this formula, we will get the SD for the manufacturing sector (Mf). Similarly, calculate the standard deviation of all the industries (see Table 2).
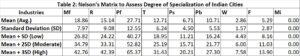
Further, add the multiples of SD to Mean/Average. It will yield various cut-points for making classes. - For example in the manufacturing sector, mean is 18.86, SD is 7.97, mean + SD = 26.82, mean + (2 x SD) = 34.79 and mean + (3 x SD) = 42.76 (see Table 2).
- Finally, the classes of degree of specialization for the manufacturing sector come as follows
- 18.86-26.82 (Low)
- 26.82-34.79 (Moderate)
- 34.79-42.76 (High)
- Thereafter, locate any city’s share of manufacturing workers in these classes and determine the degree of specialization. For example, Kolkata has 35 percent of its workforce in Manufacturing (Mf) which fall in the third category. Hence, the degree of specialization of Kolkata is very high in relation to other cities as none of the other cities fall in the third category (see Table 2).
- Likewise, we can build the classes for determining degree of specialization in other industries to determine specialization of other towns.
Relevance of Nelson’s Functional Classification
Nelson’s method is very relevant for researchers in most cases. It has following advantages over the other methods of functional classification of towns.
- Nelson’s method is a flexible method which does not limit a city to one function. Besides, the planners may define the functional specialization of towns with varying degrees. Therefore, one city may have more than one specialization to varying degrees.
- Since this method recognizes that a city may have more than one specialization, the policy makers can make appropriate policies for the city’s development.
- Furthermore, there is scope for a researcher to use Gross Domestic Product (GDP) instead of proportion of workers for classification of town by using this method.
- Above all, this classification provides exhaustive information regarding the city’s functions. On one hand, it shows the dominance of one industrial function in relation to other functions. On the other hand, it shows the degree of dominance of most dominant industry.
Criticism of Nelson’s Functional Classification
Despite the scientific vigor on Nelson’s method, there are few disadvantages of using this method for classification of cities.
- It uses only one variable for classification of all kinds of towns. This variable may not be suitable for all cities. For instance, a tourism town does not fall in any of the nine industries of this classification.
- Likewise, there is no scope for towns which are religious towns, Notified Towns and Cantonments.
- These towns lie nowhere in this classification.
- This method involves collection and analysis of large amounts of data. Hence, it may prove to be a very time consuming and lengthy method for classifying cities of large countries.
Conclusion
To sum up, we can say that Nelson’s functional classification of towns is a very objective, quantitative and exhaustive method to classify cities. Regardless of its minor drawbacks, it is one of the best functional classifications. It provides for multiple specializations for towns. A town may be highly specialized in Services but may be specialized in manufacturing too but to a lesser degree.
Kulwinder Singh is an alumni of Jawaharlal Nehru University, New Delhi and working as Assistant Professor of Geography at Pt. C.L.S. Government College, Kurukshetra University. He is a passionate teacher and avid learner.