Measuring inequality is key to formation of policy for equitable distribution of benefits of economic growth to people. Sopher’s Index is a method which measures inter-personal inequality between people and regions.
What is Sopher’s Index?
- It is used to calculate inter-personal disparity between two groups of people and regions.
- Need for Log scale: This index uses log scale to normalize the effect of base value, For example, if the literacy of male and female is 40% and 30% respectively in District A and 80% and 70% in District B respectively. There is difference of 10% in both districts. However without log scale, this method would show higher disparity in District A than District B. Hence, we use log scale.
- The sopher’s index value of Zero means perfect equality.
- There is no higher limit. As the number moves higher than zero, inequality/disparity keeps on increasing.
- This is why the numbers in themselves do not mean anything when read alone. These numbers should be interpreted in relation to the different time periods e.g. the disparity of 1991 will only mean something when compared to disparity of 2001 and 2011 (Table.1).
- It does not calculate the variation and deviation within a single series of data but between two groups of series. For instance, the disparity between male and female literacy in districts of Delhi between 1991 to 2011 can be calculated by this Index (Table.1).
The formulae is as following.
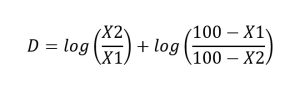
D = Disparity
X2 = Higher Value
X1 = Lower Value
Lets elaborate through practical example.
| Sopher’s Disparity Index for Literacy Rate in Delhi | |||
| Census Year | Male Literacy (X2) | Female Literacy (X1) | Sopher’s Index |
| 1991 | 64.13 | 39.29 | 0.441 |
| 2001 | 75.26 | 53.67 | 0.419 |
| 2011 | 82.14 | 65.46 | 0.385 |
- In this example the Male Literacy is higher than female literacy, therefore, male literacy has been denoted as X2 whereas the female literacy is denoted as X1.
- X1 and X2 must be percentage values.
- After applying the formula in excel i.e. =log(X2/X1)+log((100-X1)/(100-X2)), we arrived at Sopher’s Index for the year 1991, 2001 and 2011.
- It can be observed that this values has declined from 0.441 to 0.385 which means that the inter-personal disparity in literacy between male and female has also declined.
Modified Sopher’s Index
- Sopher’s Index was modified by Kundu and Rao in 1983.
- Need for Modification: The original Index fails to satisfy Principle of Additive Monotonicity. This means that if we add a constant number to all the figures in a positive data series, the inequality declines. Further, if one of the variable is 100%, the result in numerator and denominator would be 0. This will make the use of original formulae futile. Hence, Kundu and Rao modified it.
The Modified formulae is as following.
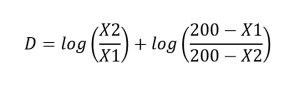
D = Disparity
X2 = Higher Value
X1 = Lower Value
For Focused Group Discussion, Click here.
Kulwinder Singh is an alumni of Jawaharlal Nehru University, New Delhi and working as Assistant Professor of Geography at Pt. C.L.S. Government College, Kurukshetra University. He is a passionate teacher and avid learner.