Homer Hoyt and M.R. Davis proposed the sector model of urban morphology in 1939. This model was based on observations from 64 cities in the USA. He modified the Concentric Zone Model by Burgess in combination with the impact of transport routes on urban morphology and came up with their own Wedge or Sector Model.
Basic Proposition
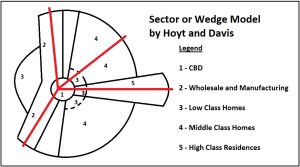
This model proposes that the pattern of urban land use is conditioned by the arrangement of transport networks which are radiating from the Central Business District (CBD). Thus, the activities which need the transport networks for their operation are located closest to the transport routes. Based on this principle, they classified city space into five zones of land-use.
Zones in Sector Model
-
Central Business District
- This zone represents the Central Business District (CBD).
- It is the center of all high end commercial activities.
- So, the land rent in the CBD is very high. Therefore, land use is very intensive.
- There are huge business offices and administrative buildings in this area.
- CBD has negligible residential areas.
- All the transport networks converge in this zone.
-
Wholesale & Manufacturing
- The wholesale and manufacturing activities are dependent on fast and efficient modes of transport for exchange of goods and services for their operation.
- Proximity to transport networks let these enterprises minimize cost of production and marketing.
- Hence, both these activities are located near the roadways and railways in an urban space as seen in Fig. 1.
-
Low Class Homes
- The wholesale & manufacturing zone is surrounded by a residential zone of blue-collar workers.
- Blue collared workers work in the wholesale and manufacturing units.
- These workers live in proximity to their workplace because they want to minimize their cost of commute (Fig.1). The roads and alleys are narrow but well connected to industries.
- The living conditions are inadequate. Homes are crowded and unventilated.
-
Middle Class Homes
- The next zone surrounding low class homes is residential zone of middle class workers.
- This zone has better residential areas than the low class homes with parks and open spaces.
- This zone is well connected to local public transport routes and commute to CBD and industrial areas. They can afford some cost of commuting in public transport.
-
High Class Residences
- The expanse of this zone is very elongated along the major roads from CBD and runs up to farthest point from the city (see zone 5 in Fig. 1).
- This zone contains the homes of high class rich people.
- The homes are very large, spacious and surrounded by green belts
- Since these homes are located farthest from the city, the residents of this zone commute to CBD by their personal cars or public transport networks.
Assessment of This Model
Hoyt and Davis proposed their model from the empirical data from 64 USA cities. Hence, it has empirical depth and is practical. This model explains the real world situation as explained below.
- The advantage of this theory is that it explains the distance and direction of expanse of city space in a very realistic manner. The city generally expands along transport networks.
- The industrial activities are also located near large roads.
- The low class workers reside near industrial areas in cheap homes.
- Rich people buy large farmhouses in the city periphery and live there. They commune their large homes for
Criticism of the Sector Model
- Rich and poor regions in developing countries co-exist. The poor usually reside in slums and shanties near the affluent areas and provide cooking and cleaning services.
- This model gives no regard to the role of planners in city development. Usually, the planners allocate different parts of the city to different land-uses.
- In India, the rich people continue to live in the city center whereas the middle class move outwards due to the high cost of house rent.
- Over time, the functions of the CBD move out to other subsidiary CBDs. Hence, the city has many large specialized CBDs.
Conclusion
To summarize, the sector model logically explains the city morphology by incorporating the effect of the transport network on city scale. This theory proves to be broadly successful in explaining the city morphology. However, this is based on one country i.e. USA. This theory takes the city as a constant space whereas it grows and changes its morphology over time as explained by Harris and Ullman in their Multiple Nuclei Model.
Kulwinder Singh is an alumni of Jawaharlal Nehru University, New Delhi and working as Assistant Professor of Geography at Pt. C.L.S. Government College, Kurukshetra University. He is a passionate teacher and avid learner.