J. C. Weaver’s crop combination method is one of the simplest and the most objective techniques to delineate agricultural regions.
What is Crop Combination
- Crop combination refers to the most dominant group of crops which are being cultivated in a region for a particular time period (mostly year).
- The basic idea of Weaver’s method is that the most dominant crops are representative of natural, cultural and economic situation of an area.
- Weaver used quantitative techniques to arrive at the agricultural regions.
- He calculated dominance with respect to the Gross Cropped Area for a specific crop or crop combination.
Let us understand the method in practice as following.
Crop Combination Formulae by Weaver
Weaver used Standard Deviation formulae for arriving at most dominant crop combination.
The formulae is as following.
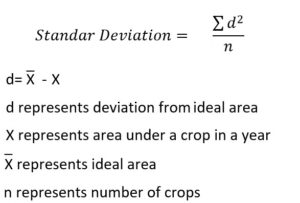
Please note that “ideal area” represents the equal divisions of total area for all crop. Ideal area and area under a crop are calculated in percentage for use in the above formulae.
Steps to Use Weaver’s Method
Step 1
First determine if you want to regionalize based on nation-wise data, state-wise data or district-wise data.
Step 2
If data for your choice of spatial scale is available i.e. state, district, block etc. the researcher must collect two types of data i.e. Total Cropped Area and Area Under Different Crops in a year. Number of crops in each district or states may vary. However, data for all crops must be collected. One can access the data related to crops’ area, production and yield at Ministry of Agriculture website.
Step 3
Calculate the “ideal area” for each region. Ideal area is percentage of area which can be allocated equally to each crop. For instance, if an area, say, Ludhiana District of Punjab grows 3 crops in a year, then ideal area for each crop will be 100 percent divided by 3 i.e. 33.33 percent. Similarly, ideal area for a district with four crops will be 100 divided by 4 i.e. 25 percent.
Step 4
Calculate percentage of area under each crop in a district. One can calculate area under a crop easily. For example, if the area under wheat is 58,000 acres and total area is 150,000 acres then divide 58,000 by 150,000 and multiply by 100. It will be 38.66 percent. you have to repeat this calculation for each crop in a district.
Step 5
Arrange the area under each crop in descending order. For instance, assume that the percentage of area under rice, wheat and pulses is 32, 40 and 34, respectively. Then arrange the data as 40, 34 and 32.
Step 6
Now, use the data calculated in step 3 and 4 in the formulae. Please note that the one has to repeat the calculation so many times that equals number of crops. For example, if there are three crops, one has to use the formulae three times as mentioned in next section. If number of crops is six, you have to use the formulae six times.
In the end, the researcher will have standard deviation for each crop combination. The crop combination with lowest standard deviation will be the dominant crop combination of the region. Let’s calculate with the help of an example.
Crop Combination Example
In the following example, one can easily learn to use the above steps. Let us take the data of crops for Ludhiana district of Punjab as shown in Table 1.
| Table 1: Area Under Different Crops in Ludhiana District | |||
| Sr. No | Crops | Area (Thousand Hectares) | Area in % (X) |
| 1 | Rice | 55 | 35 |
| 2 | Wheat | 45 | 29 |
| 3 | Sugarcane | 25 | 16 |
| 4 | Pulses | 20 | 13 |
| 5 | Mustard | 10 | 6 |
| Total | 155 | 100 | |
The calculation of crop combination for the Ludhiana District is as following.
| Table 2: Calculation of Crop Combination for above District | ||||||
| Crop Combination | Ideal Area | Area in % (X) | Deviation (d) | d^2 | Standard Deviation = d^2/n | |
| Monoculture (n=1) | 100/1 = 100 | rice = 35 | 100-35 = 65 | 4225 | 4225/1 = 4225 | |
| Two Crops (n=2) | 100/2 = 50 | rice = 35 wheat = 29 |
(50-35) + (50-29) = 36 |
1296 | 1296/2 = 648 | |
| Three crops (n=3) | 100/3 = 33.33 | rice = 35 wheat = 29 Sugarcane = 16 |
(33.33-35) + (33.33-29) + (33.33-16) = 19.34 |
374.22 | 374.22/3 = 124.74 | |
| Four Crops (n=4) | 100/4 = 25 | rice = 35 wheat = 29 Sugarcane = 16 Pulses = 13 |
(25-35) + (25-29) + (25-16) + (25-13) = 6.40 |
41.60 | 41.60/4 = 10.4 | |
| Five Crops (n=5) | 100/5 = 20 | rice = 35 wheat = 29 Sugarcane = 16 Pulses = 13 Mustard = 6 |
(20-35) + (20-29) + (20-16) + (20-13) + (20-6) = 0.00 |
0 | 0/5 = 0 | |
You can see in Table. 2 that the standard deviation for five crops is lowest. Hence, the Ludhiana is a region with five dominant crops. You can write RWSPM as the crop combination of Ludhiana. The districts which have similar crop combination adjacent to Ludhiana will be clubbed together to form crop combination region.
Demerit of Weaver’s Method
- Weaver considers crop cultivation as an isolated activity. Whereas, crop cultivation is combined with animal husbandry, horticulture, floriculture, apiculture etc.
- He devised his method to delineate agricultural regions in U.S.A. where landholding is large. However in India, landholdings are small and fragmented. Therefore, the diversity of crops vary from field to field.
- Using Weaver’s method is a very comprehensive exercise. One has to calculate standard deviation for each district and check for all the crop combination. It becomes a lengthy exercise.
- Since, the diversity of crops is great in India, this method’s ability to help in regionalization is questionable. It is so because the total area might be under many different crops. This means that the crop combination may show each region to be multiple cropping region. Hence, objectivity is lost.
Conclusion
To sum up, we can say that Weaver’s crop combination method is a great statistical tool to delineate the agricultural regions. It is specially helpful in agricultural regionalization in the areas of relatively lesser crop diversity.
Kulwinder Singh is an alumni of Jawaharlal Nehru University, New Delhi and working as Assistant Professor of Geography at Pt. C.L.S. Government College, Kurukshetra University. He is a passionate teacher and avid learner.