Human Development Index (HDI) is an index developed by the United Nations Development Programme (UNDP) of UNO to measure the overall development among the countries, states or communities of this world. This index is based on the work of Mehbub Ul Haq and Amartya Sen. There are three key indicator of HDI i.e. Health, Education and Living Standard (Fig. 1). The HDI values range from 0 to 1. Further, zero means the lowest lowest HDI and one means the highest HDI. India ranks 131st with an HDI of 0.645 among 188 countries in 2020.
Indicators of HDI
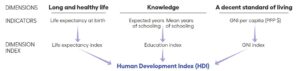
-
Health
- Life expectancy is the variable which represents the overall health of human beings. Greater number of years lived means greater amount of health facilities and nutrition.
- Generally, the average life expectancy of countries ranges from 20 years to 85 years.
- This indicator has 1/3rd (0.333) weightage in HDI.
-
Education
- Education represents the availability of opportunities available to a person.
- The UNDP uses two variables for calculating educational achievements of a country.
- The first indicator is Expected Years of Schooling. Its minimum value is 0 and the maximum value is 18. It carries weightage of 1/6th (0.1666) weightage in HDI.
- The second indicator is Mean Years of Schooling. Its minimum value is 0 and the maximum value is 15. It carries weightage of 1/6th (0.1666) in HDI.
-
Living Standard
- Living standard is a representation of Income level of a person.
- In India’s context, it is per-capita Net Domestic Product (NDP) normalized by Purchasing Power Parity.
- UNDP calculates it in US Dollars ($).
- It carries 1/3rd (0.333) weightage.
Calculation of HDI
The UNDP uses the following steps to calculate HDI.
- Firstly, collect the data of all the indicators for different countries or states.
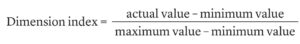
Fig. 2: Dimension Index for Variables - Secondly, an Index (Ix) is constructed for all the indicators using the data. Its formulae is as shown in Fig. 2. After applying this formulae we get the Index of Health, Education and Income. For example, if the given life expectancy of India is 67 years, the Health Index of India will be ((67-20)/(85-20)) i.e. 47 divided by 65 and it equals to 0.72. Therefore, 0.72 is our Health Index. Please note again that 20 and 85 are the minimum and maximum values of life expectancy, respectively. Similarly, we will calculate the index for Education and Income. Additionally, we have two indicators for the index of education, therefore, we will get two education indexes. In this case, UNDP adds the two indexes and divides it with 2. At last, we get the Index for Education having 1/3rd weightage.

Fig. 3: HDI Formulae - Lastly, after the calculation of all dimension indexes for each country separately, we will calculate HDI for each country by applying following the formulae as shown in Fig. 3. The final values will vary between 0 and 1. Zero means the lowest lowest HDI and one means the highest HDI.
HDI Categories
The various countries of the world are classified into four major development categories based on their HDI values.
| HDI Values | Category of Development |
| Below 0.550 | Low Human Development |
| 0.550–0.699 | Medium Human Development |
| 0.700–0.799 | High Human Development |
| 0.800 and above | Very High Human Development |
Summary
In short, HDI is a quantitative method to measure development with easily available data. Undoubtedly, the trends in HDI point towards the trajectory of development in a country. However, it ignores the inequalities within a country. Therefore, UNDP came up with Inequality Adjusted HDI.
Kulwinder Singh is an alumni of Jawaharlal Nehru University, New Delhi and working as Assistant Professor of Geography at Pt. C.L.S. Government College, Kurukshetra University. He is a passionate teacher and avid learner.