Satellite imagery is the most popular tool in the modern world to assess and analyze a large piece of earth’s surface. Most researchers and students of spatial sciences use this tool for monitoring land use, land cover change, climate change, weather forecast, disaster management and other environmental change. Therefore, a beginner needs to know different types of satellite imagery and their properties for efficient use in their academic career. Let us first understand the meaning and characteristics of satellite imagery.
Definition of Satellite Imagery
Satellite imagery refers to a photograph of a given part of the earth surface captured in an orderly manner by the satellite sensors by using various bands of electromagnetic spectrum. They have the following characteristics.
- Organized and Orderly: The satellites capture the images of the earth surface in an organized and orderly manner which ensures the coverage of the whole earth surface without overlapping.
- Captured by Sensors in Satellites: The sensors in the satellites capture the images of earth surface by using different electromagnetic spectrums depending on the purpose of research.
- Resolution: Each imagery contains a certain level of information. This amount of information in an imagery depends on the resolution of the imagery. There are Four Types of Resolutions. However pixel density and size determine the clarity of a satellite imagery. Large pixels hide the details whereas the smaller pixels capture minute differences in landscape.
- Specific Coordinates: Each imagery is georeferenced. It means that each imagery has specific coordinates which conveys the location of imagery on the globe. Without coordinates, imageries have no use.
- Specific Time: Each imagery is classified based on the time of capturing the image by the sensor. The time stamps allow us to study the change in various socio-economic and natural phenomena. Otherwise, we will not be able to understand the direction of change.
Types of Satellite Imagery
Based on Use in Meteorology
The meteorologists classify satellite imagery into three types based on their usage in meteorology and climatology. There are three such types.
-
Visible Imagery
- Visible imagery shows the landscape and atmosphere in the visible spectrum with a wavelength of 0.4-0.7 microns (µm).
- The satellites can only capture the earth features during the day by using this spectrum.
- It is easy to observe snow cover, cloud cover, fog and water bodies in visible images.
- The white area on visible imagery represents snow and clouds but we can differentiate them easily. The snow covered areas have rivers and lakes whereas the clouds come across a plain white. The water bodies are black.
- These weather observing properties of visible images make them very useful for weather forecasts and early warning for cyclones and thunderstorms.
-
Infrared Imagery
- The infrared spectrum is invisible to the human eye and has a wavelength of 0.7 µm to 1 mm.
- Unlike visible imagery, infrared sensors can capture images during the day as well as the night.
- It is most sensitive for reading heat signatures on earth surface. Therefore, infrared sensors can sense any object which emits heat.
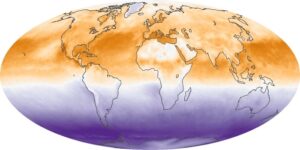
Fig. 1: Infrared Imagery of Heat Radiation in False Color Composite
Credit: https://earthobservatory.nasa.gov - We can use the infrared images for monitoring vegetation cover, type of vegetation, forest fires, global warming, air pollution, quantity of carbon dioxide in atmosphere, urban heat islands, cloud cover etc.
- In atmospheric sciences, the infrared sensors do not provide information about the regions with clear sky. Therefore, the meteorologists use a special type of satellite imagery i.e. water vapor imagery.
-
Water Vapor Imagery
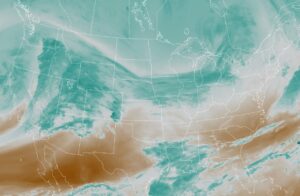
Fig. 2: Water Vapor Imagery
Credit: www.nesdis.noaa.gov- Water vapor images are captured by using a near infrared band with a wavelength of 7.3 µm. This band is very sensitive to the presence of moisture in the air.
- Hence, the water vapor imagery shows the condition of the atmosphere even when there is absence of cloud cover, fog, snow etc.
- It is easy to monitor the direction and speed of winds by using water vapor imageries even when the skies look clear in visible and infrared imageries.
- In Fig. 2, the blue and white areas have high atmospheric moisture whereas the brown and orange color show dry air. The movement of moist and dry air help us to understand the atmospheric circulation in clear weather conditions by using this imagery.
Based on Spectral Resolution
The above classification of satellite imageries is specific to climatology. However, the classification of imageries based on spectral resolution is more suitable for other disciplines. There are three types of imageries based on spectral resolution.
-
Mono-Spectral Imagery
- Mono-spectral imageries are captured by using a single band of electromagnetic spectrum.
- The mono-spectral sensors capture any one of the X-ray, UV ray, visible, infrared, microwave and radio waves.
- Hence, we use mono-spectral imagery for targeted purposes.
- For example, we can differentiate between broadleaf and needleleaf vegetation cover by using 0.76 µm wavelength in the infrared spectrum. The broadleaf plants has greater reflectance in this band than the needleleaf plants.
-
Multi-Spectral Imagery
- Multi-spectral imagery uses 3-10 bands for capturing a single imagery.
- In this type of imageries, multiple sensors capture the image in different bands of electromagnetic spectrum e.g. infrared, visible, Ultraviolet etc.
- Note that the visible spectrum is itself a large spectrum with violet, indigo, blue, green, red, orange and yellow colors. Similarly, the infrared waves are also of many types e.g. near infrared, short-wave infrared, long-wave infrared etc.
- Hence, an imagery which shows many smaller bands of a larger spectrum type, is also a multi-spectral imagery.
- We use such imageries because a single band is not able to sense each and every object on the earth surface. When we need to study the processes on earth’s surface in association with each other, we need multispectral images.
- For instance, if we are analyzing the relationship between soil salinity and irrigation, we need two different bands which can sense salinity as well as the water.
-
Hyper-Spectral Imagery
- Hyper-spectral imageries use more than 10 bands of spectrum extending up to hundreds.
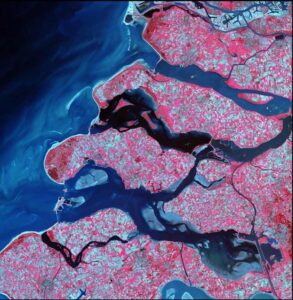
Fig. 3 : Hyperspectral Imagery of Delta Region of Netherlands
Credit: Indian Institute of Remote Sensing, Dehradun - Hyper-spectral sensors are able to differentiate finer wavelengths from each other within a small band. The bands in multispectral imagery are wider than the hyperspectral imagery.
- For example, the multispectral sensor using blue color wavelength will show every blue object on earth in blue color. It will not differentiate different shades of blue color from each other. Contrarily, the hyperspectral sensor can differentiate between different shades of blue (Fig. 3) because it is able to sense smaller wavelengths within the blue color band.
- Hyper-spectral imageries use more than 10 bands of spectrum extending up to hundreds.
We can also classify imageries based on size of pixel and density of pixels in imageries. However, the pixel size and density varies from one sensor to another. Therefore, there will be hundreds of types of imageries based on pixel size.
Click here for Use of Remote Sensing in Geography.
Conclusion
It is discernible from the above discussion that there are thousands of bands in the electromagnetic spectrum. We can use either one or multiple wavelengths for capturing a satellite imagery. The choice of wavelength depends on the purpose of the study. The collection and storage of remotely sensed data takes a lot of economic resources, therefore the researchers need to collect only specific types of data. Unnecessary collection of data through various wavelengths leads to wastage of resources.
Kulwinder Singh is an alumni of Jawaharlal Nehru University, New Delhi and working as Assistant Professor of Geography at Pt. C.L.S. Government College, Kurukshetra University. He is a passionate teacher and avid learner.